Original analysis of federal weather and river data
Durham rain, freeze and flood data
Durham's water damage traces back to heavy summer and tropical rain, short hard freezes, and the Eno with its feeder creeks. The record for each comes from daily weather at Raleigh-Durham International Airport and the river gauge on the Eno at Durham (run by USGS with NWS flood stages), plus federal flood insurance claims.
Average rain by month (inches)
Average days with measurable rain, by month
What we found
- Summer is the wet season. The airport averages 46.1 inches a year (1991-2020) on about 117 wet days, and 56% of it falls April through September. July through September average 14.9 inches together.
- Heavy days are more common. Days with an inch or more averaged 13.4 a year over 2016-2025, against 11.7 over 1991-2020. The wettest single day on record is October 8, 2016 (Hurricane Matthew), 6.45 inches. 2018 was the wettest year since 1945: 60.33 inches.
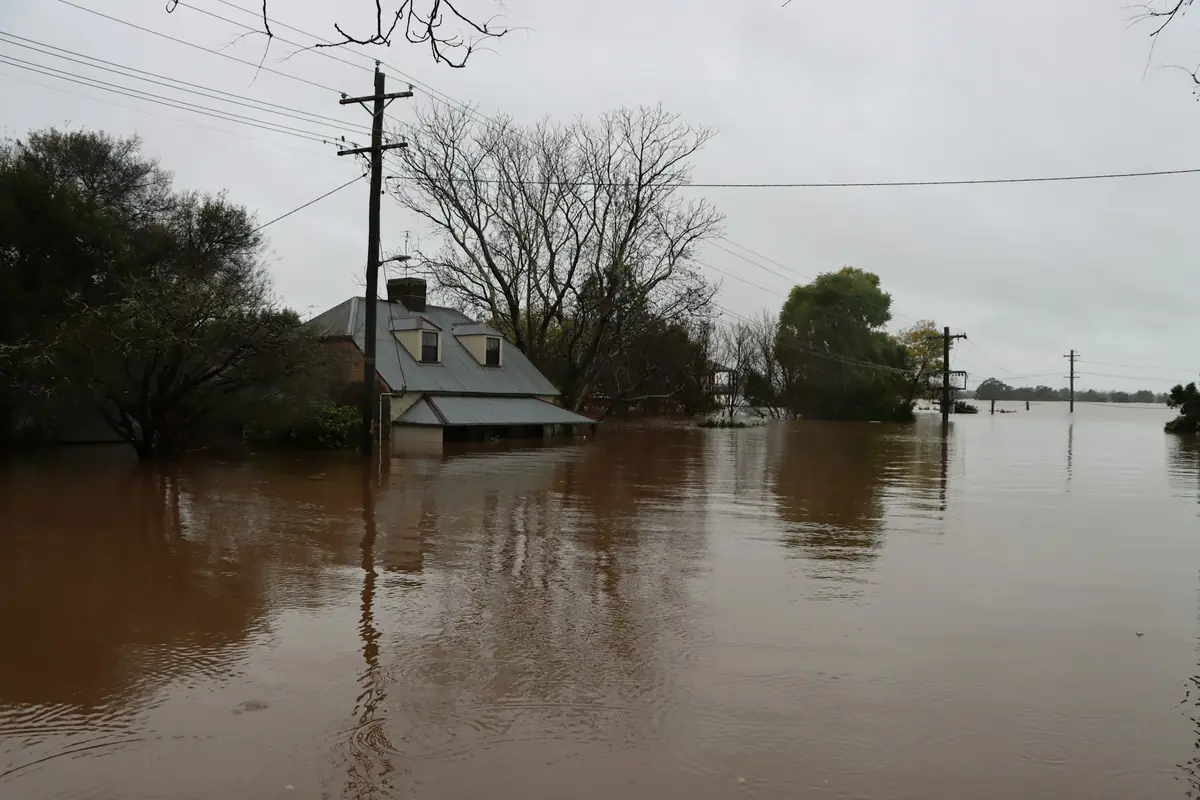
- Tropical storms set the records. Hurricane Fran dropped 8.8 inches on the airport in three days in September 1996, and Floyd 8.46 in 1999. Chantal in July 2025 fell mostly west of the airport, which recorded 0.99 inches while the Eno, fed from Orange County, went to a record crest.
- The Eno's three biggest floods since 1996. The NWS crest list for the Eno at Durham shows 26.24 feet on July 7, 2025 (Chantal, preliminary), 23.58 feet on September 6, 1996 (Fran) and 23.06 feet on September 17, 2018 (Florence), against a major flood stage of 24 feet. In 4 of the 35 published water years since 1990, the annual peak reached the minor flood stage of 20 feet.
- Hard freezes come in snaps. 4.8 nights a year at 20°F or colder over 2016-2025 (7.6 over 1991-2020). They cluster: 8 nights from January 1, 2018, down to 4°F, 4 from December 23, 2022, down to 10°F, and 4 from January 30, 2026, down to 11°F.
- Chantal is the costliest flood on record here. 443 NFIP claims in Durham County, $11.0 million paid, $31,658 per paid claim. Chantal's 43 claims so far account for $4.9 million, 45% of everything the program has paid in the county. Fran brought more claims (73) but far less money ($0.7 million, in 1996 dollars).
Highest flow each water year, Eno River at Durham (cubic feet per second)
Highest crests at Durham
| Date | Crest | Flow (cfs) | NWS category |
|---|---|---|---|
| July 7, 2025 | 26.24 ft | 14,500 | Major |
| September 6, 1996 | 23.58 ft | 14,700 | Moderate |
| September 17, 2018 | 23.06 ft | 13,732 | Moderate |
| March 19, 1998 | 20.76 ft | 10,800 | Minor |
| April 15, 2017 | 20.28 ft | 10,300 | Minor |
| April 26, 1978 | 19.65 ft | 9,620 | Action |
| February 7, 1965 | 15.18 ft | 9,080 | Below flood stage |
NWS National Water Prediction Service crest list for gauge ENON7 (USGS 02085070). The July 2025 crest is marked preliminary. Categories: action 18 ft, minor 20, moderate 22, major 24.
Nights per year at 20°F or colder, Raleigh-Durham International Airport
Recent cold snaps
| Began | Nights at 20°F or below | Lowest |
|---|---|---|
| February 8, 2026 | 2 | 14°F |
| January 30, 2026 | 4 | 11°F |
| January 24, 2026 | 2 | 18°F |
| December 14, 2025 | 2 | 14°F |
| January 21, 2025 | 4 | 16°F |
| January 21, 2024 | 2 | 18°F |
| December 23, 2022 | 4 | 10°F |
Consecutive nights with a low at or below 20°F, Raleigh-Durham International Airport, most recent first.
Average nights at 25°F or colder, by month
Federal flood insurance claims per year, Durham County
Wettest three-day stretches
| Ending | Rain |
|---|---|
| September 17, 1945 | 10.05 in |
| September 6, 1996 | 8.80 in |
| September 6, 1999 | 8.46 in |
| April 25, 2017 | 7.45 in |
| October 9, 2016 | 6.94 in |
| September 16, 1999 | 6.55 in |
Rolling three-day totals, Raleigh-Durham International Airport, 1944 to 2026.
Flood claims and housing by ZIP code
These counts are NFIP claims and nothing else. The everyday leak or frozen pipe goes to a homeowners policy and leaves no trace in this table.
| ZIP | Area | NFIP claims | Fran, Sep 1996 | Florence, Sep 2018 | Chantal, Jul 2025 | Paid | Median year built | Built before 1980 | Renter occupied | Homes |
|---|---|---|---|---|---|---|---|---|---|---|
| 27707 | South central Durham and Hope Valley | 97 | 11 | 14 | 1 | $2,052,908 | 1985 | 28% | 52% | 23,657 |
| 27704 | Northeast Durham | 85 | 18 | 13 | 22 | $3,954,579 | 1987 | 32% | 39% | 16,578 |
| 27712 | North Durham | 64 | 9 | 8 | 16 | $2,281,578 | 1989 | 13% | 10% | 9,768 |
| 27705 | West Durham and Duke | 60 | 12 | 8 | 2 | $831,557 | 1987 | 23% | 56% | 25,051 |
| 27701 | Downtown and central Durham | 41 | 9 | 2 | 0 | $405,018 | 1975 | 45% | 70% | 14,073 |
| 27713 | South Durham and Southpoint | 40 | 1 | 0 | 1 | $549,486 | 1999 | 6% | 41% | 26,992 |
| 27703 | East Durham and the Brier Creek edge | 34 | 7 | 0 | 0 | $665,521 | 2005 | 15% | 34% | 28,393 |
| 27503 | Bahama | 2 | 0 | 1 | 0 | $7,910 | 1986 | 8% | 10% | 1,565 |
| 27572 | Rougemont | 0 | 0 | 0 | 0 | $0 | 1995 | 13% | 9% | 2,681 |
Claims: OpenFEMA FIMA NFIP redacted claims (v3), every year, grouped by the ZIP reported on the claim; the storm columns count losses dated in that storm's month. Housing: Census ACS tables B25001 and B25003 (plus B25034 and B25035) from the 2020-2024 five-year release, by ZCTA. Sort by clicking a heading.
Federal disaster declarations for storms and floods
| Incident began | Event | Type |
|---|---|---|
| January 21, 2026 | Severe Winter Storm | Emergency |
| July 6, 2025 | Tropical Depression Chantal | Major disaster |
| September 25, 2024 | Hurricane Helene | Emergency |
| August 5, 2024 | Tropical Storm Debby | Emergency |
| September 28, 2022 | Hurricane Ian | Emergency |
| July 31, 2020 | Hurricane Isaias | Emergency |
| September 1, 2019 | Hurricane Dorian | Emergency |
| September 7, 2018 | Hurricane Florence | Emergency |
| September 7, 2018 | Hurricane Florence | Major disaster |
| October 4, 2016 | Hurricane Matthew | Emergency |
| August 29, 2005 | Hurricane Katrina Evacuation | Emergency |
| September 18, 2003 | Hurricane Isabel | Major disaster |
| December 4, 2002 | Severe Ice Storm | Major disaster |
| January 24, 2000 | Severe Winter Storm | Major disaster |
| September 15, 1999 | Hurricane Floyd Major Disaster Declarations | Major disaster |
| September 15, 1999 | Hurricane Floyd Emergency Declarations | Emergency |
| March 20, 1998 | Severe Storms Tornadoes, and Flooding | Major disaster |
| September 5, 1996 | Hurricane Fran | Major disaster |
| January 6, 1996 | Blizzard Of 96 | Major disaster |
| March 13, 1993 | Severe Snowfall and Winter Storm | Emergency |
| May 5, 1989 | Tornadoes | Major disaster |
| March 2, 1977 | Drought and Freezing | Emergency |
OpenFEMA Disaster Declarations Summaries for Durham County: hurricanes and floods, plus winter storms.
How we built this
Rain and cold. Daily precipitation and temperature at Raleigh-Durham International Airport (GHCN USW00013722) from NOAA's Applied Climate Information System, 1944 to October 28, 2026. We count any day with 0.01 inch or more as wet. Years missing more than ten days are left out of averages, which leaves 81 full years. The airport sits about ten miles east of downtown, so a storm that hits Durham and misses the airport, like Chantal, shows up in the river record instead.
River. USGS annual peak streamflow for the Eno River at Durham (02085070), 1964 on, plus the National Weather Service crest list and flood categories for gauge ENON7. The July 2025 crest comes from the NWS list until USGS publishes the water year 2025 peak.
Claims and housing. Durham County rows from the OpenFEMA NFIP redacted claims file (v3) and the disaster declarations summaries, plus five-year Census ACS 2020-2024 figures by ZCTA.
Limits. A single airport station and a single river gauge can't speak for every block, and the federal claims file keeps filling in for months after each flood. Read it as a picture of the county; a specific house needs its own inspection.
Reuse. Quote or reprint these Durham charts and tables under CC BY 4.0 with a link back here; that goes for reporters and home inspectors as much as anyone.